El Nino Update
El Niño continues to strengthen and is still projected to become very strong by late Fall 2026 into Winter 2026-2027.
September 18, 2026
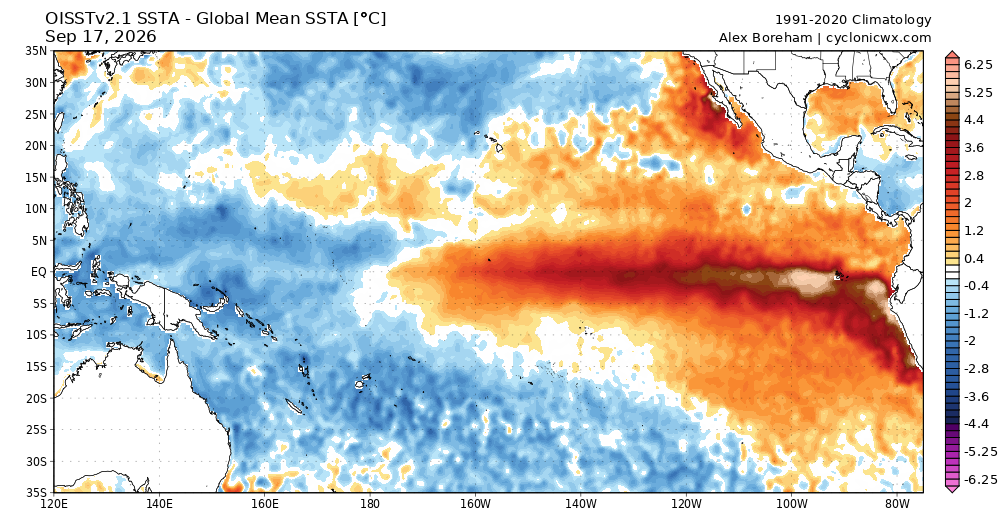
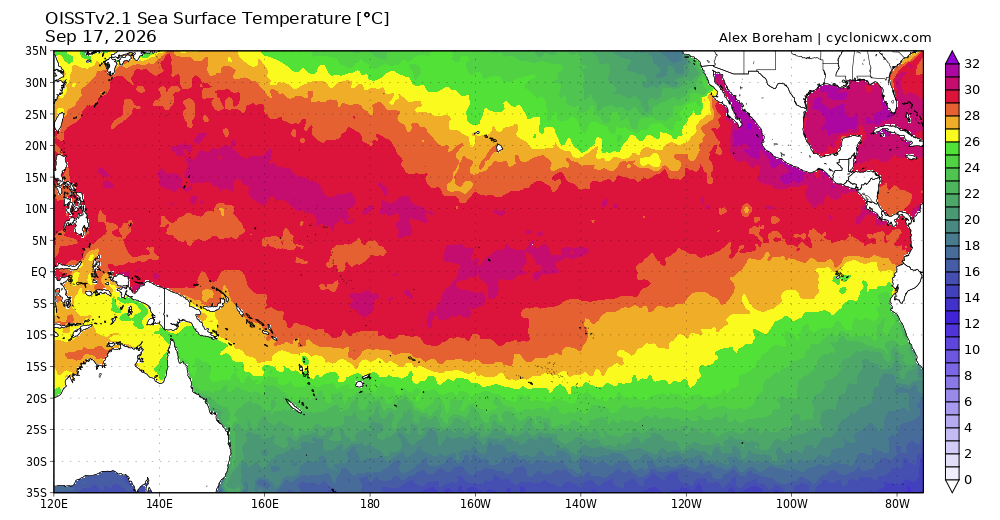
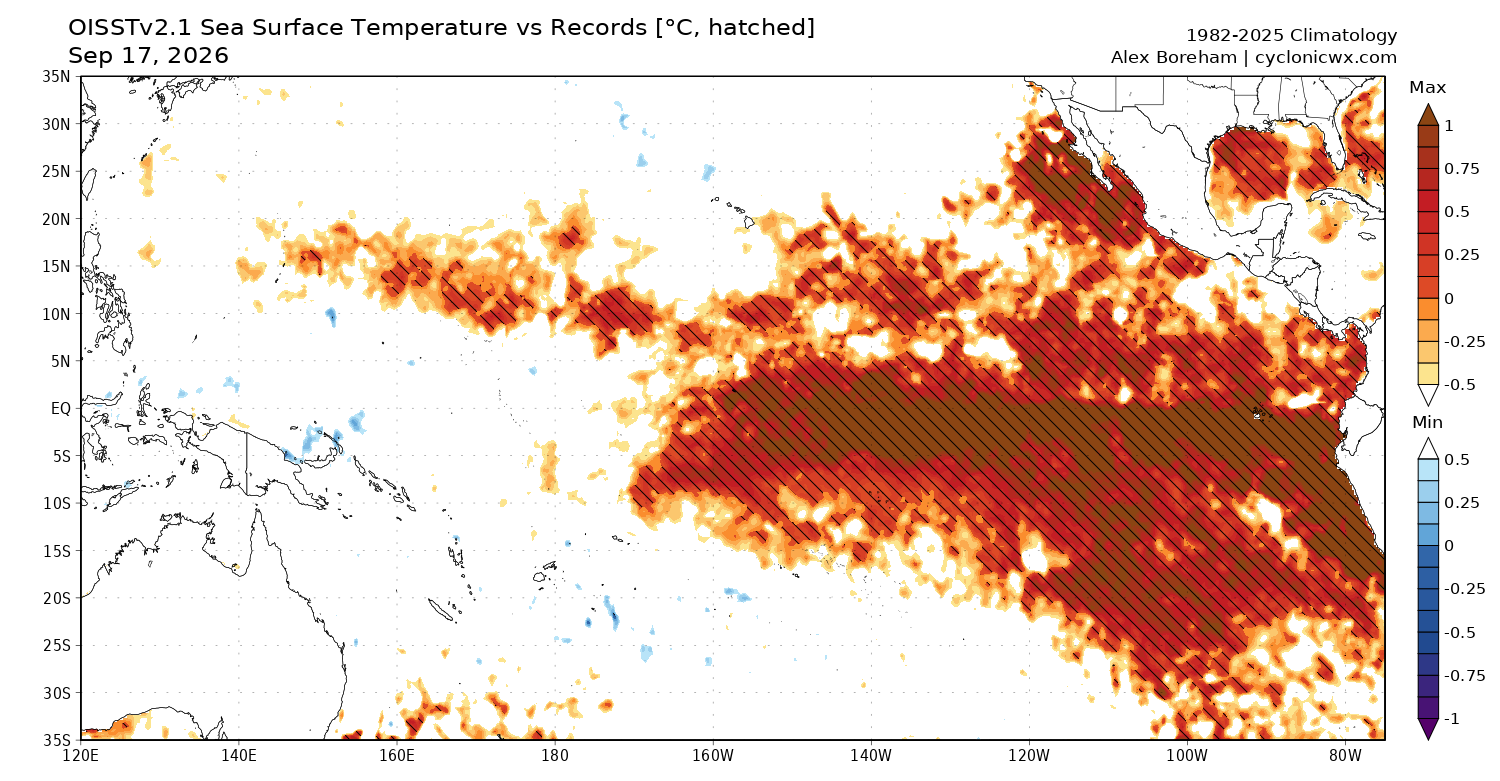
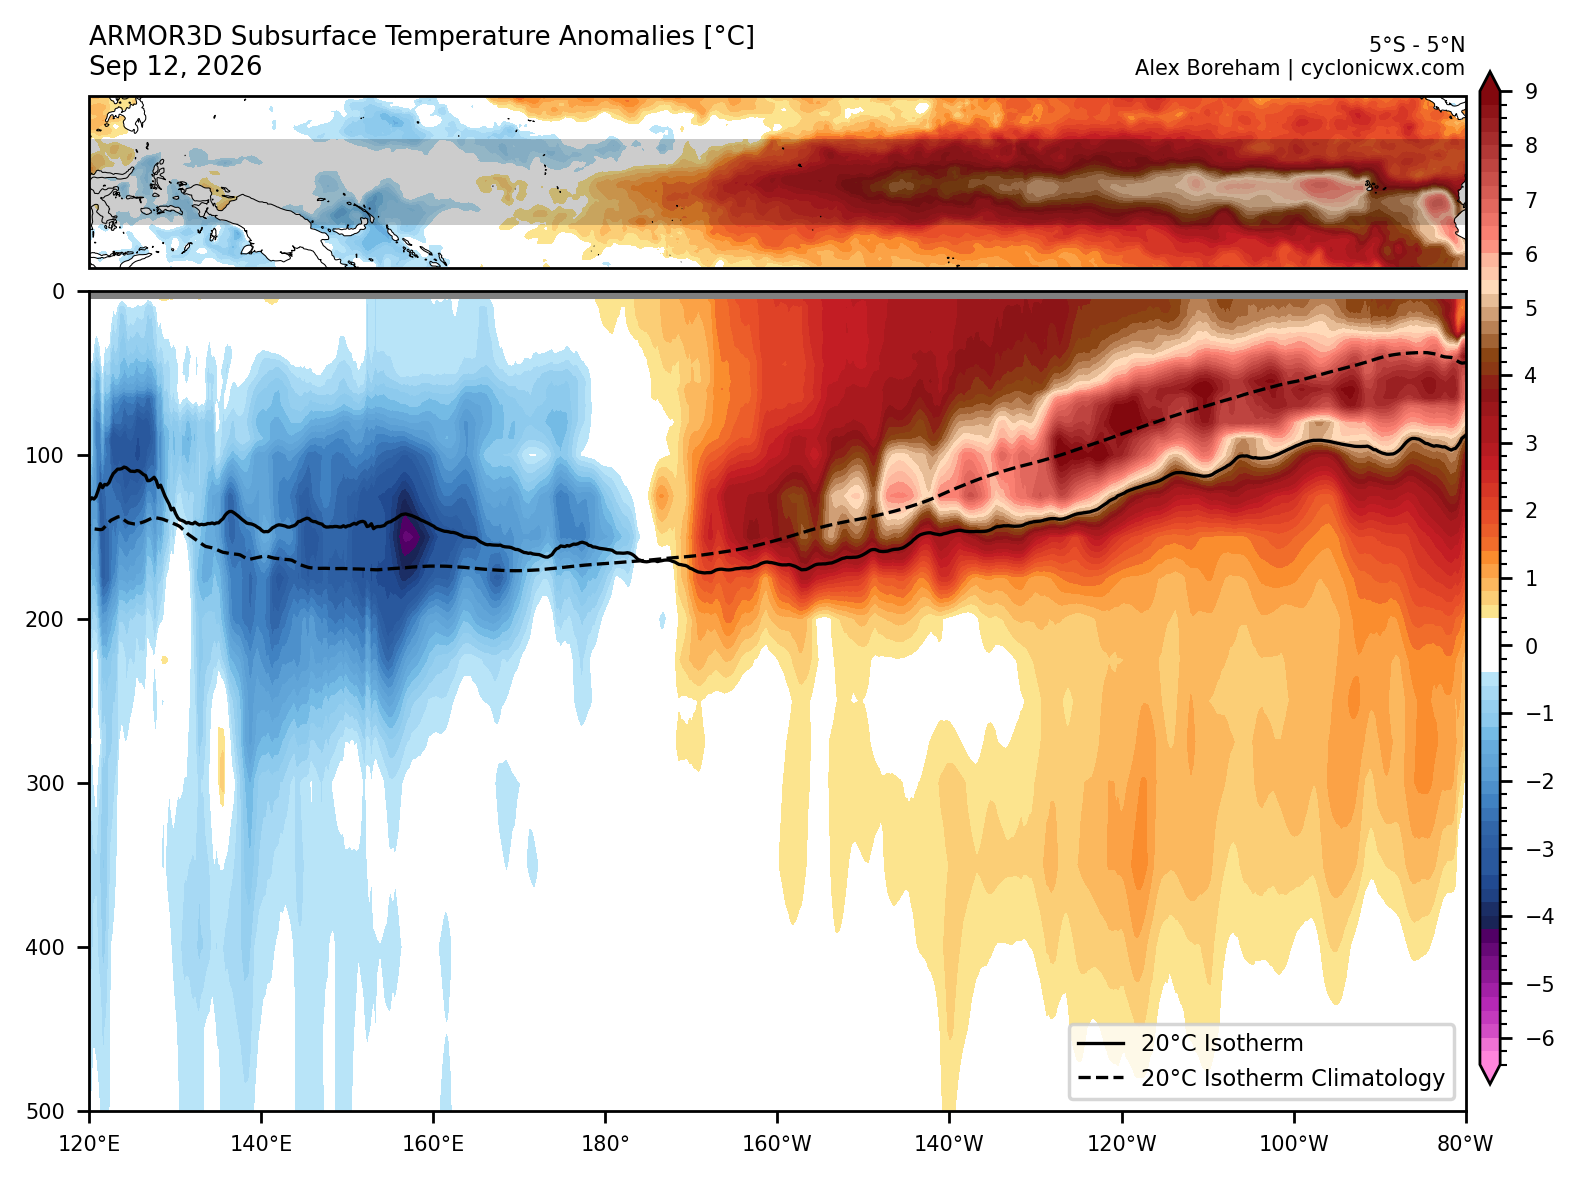
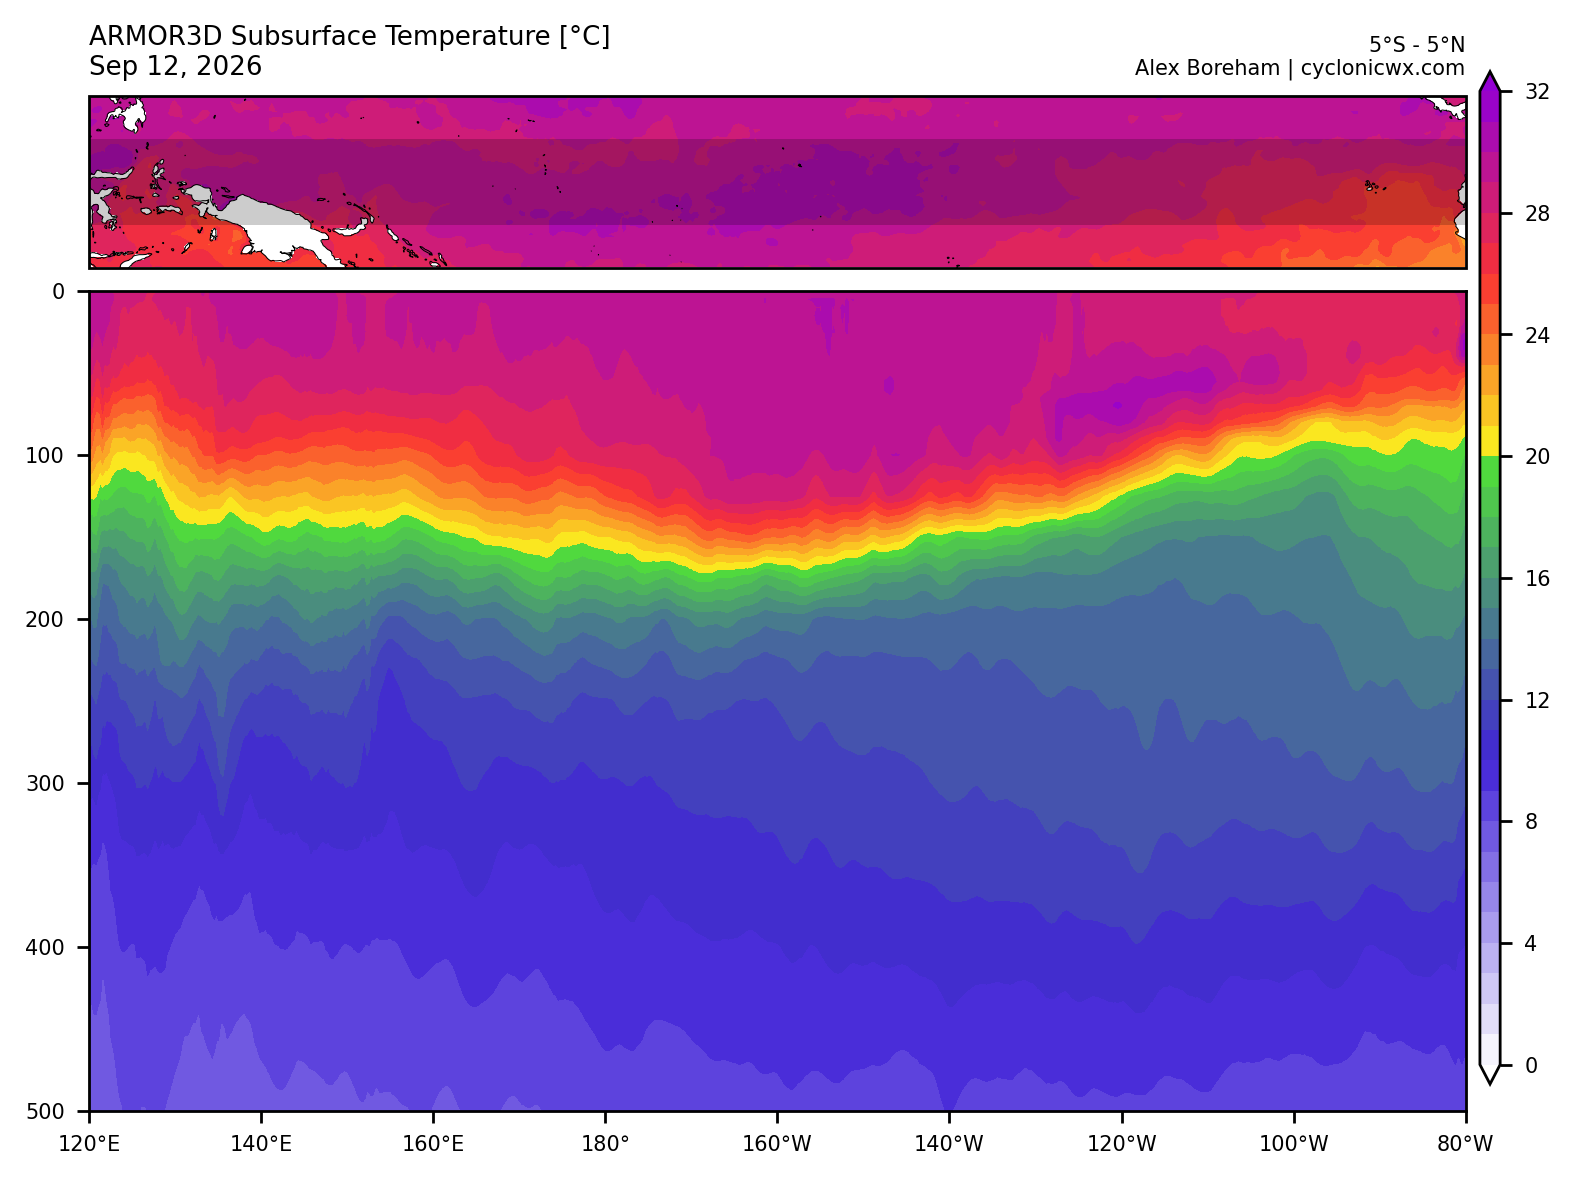
Sea surface temperatures continue to warm in the central Pacific, with the latest 15-day average coming in at 29.59C or 85.3F. More importantly, the Relative Oceanic Niño Index (RONI), which removes global tropical anomalies, is hovering around +2.42C or +4.32F above normal. At this time, when relying on the RONI index, this El Niño ranks #1 on this day, 9/18/2026, but is ranking #3 out of 1 with 1982-83, 1997- 98, 2015-16. Which is quite impressive. Now, when assessing the ELI index, the ENSO Longitude Index (ELI) tracks the average longitude of the strongest tropical Pacific convection, rather than just sea-surface temperatures. When the ELI shifts eastward, it means the main convective and rising-motion center has moved farther into the central or eastern Pacific, which is typical of El Niño and can strongly affect the Pacific jet and North American weather patterns. A westward ELI indicates convection is focused closer to Indonesia and the western Pacific, which is more La Niña-like. Right now, the latest ELI index is located 167.5W whitch is blowing past record-to-shame; this is impressive. Also, this El Niño is setting new all-time records for being the most east-based. My own index is sitting at -3.85, which is an all-time record, which grabs the SSTA in the Niño 4 region minus the SSTA in the Niño 1+2 region.
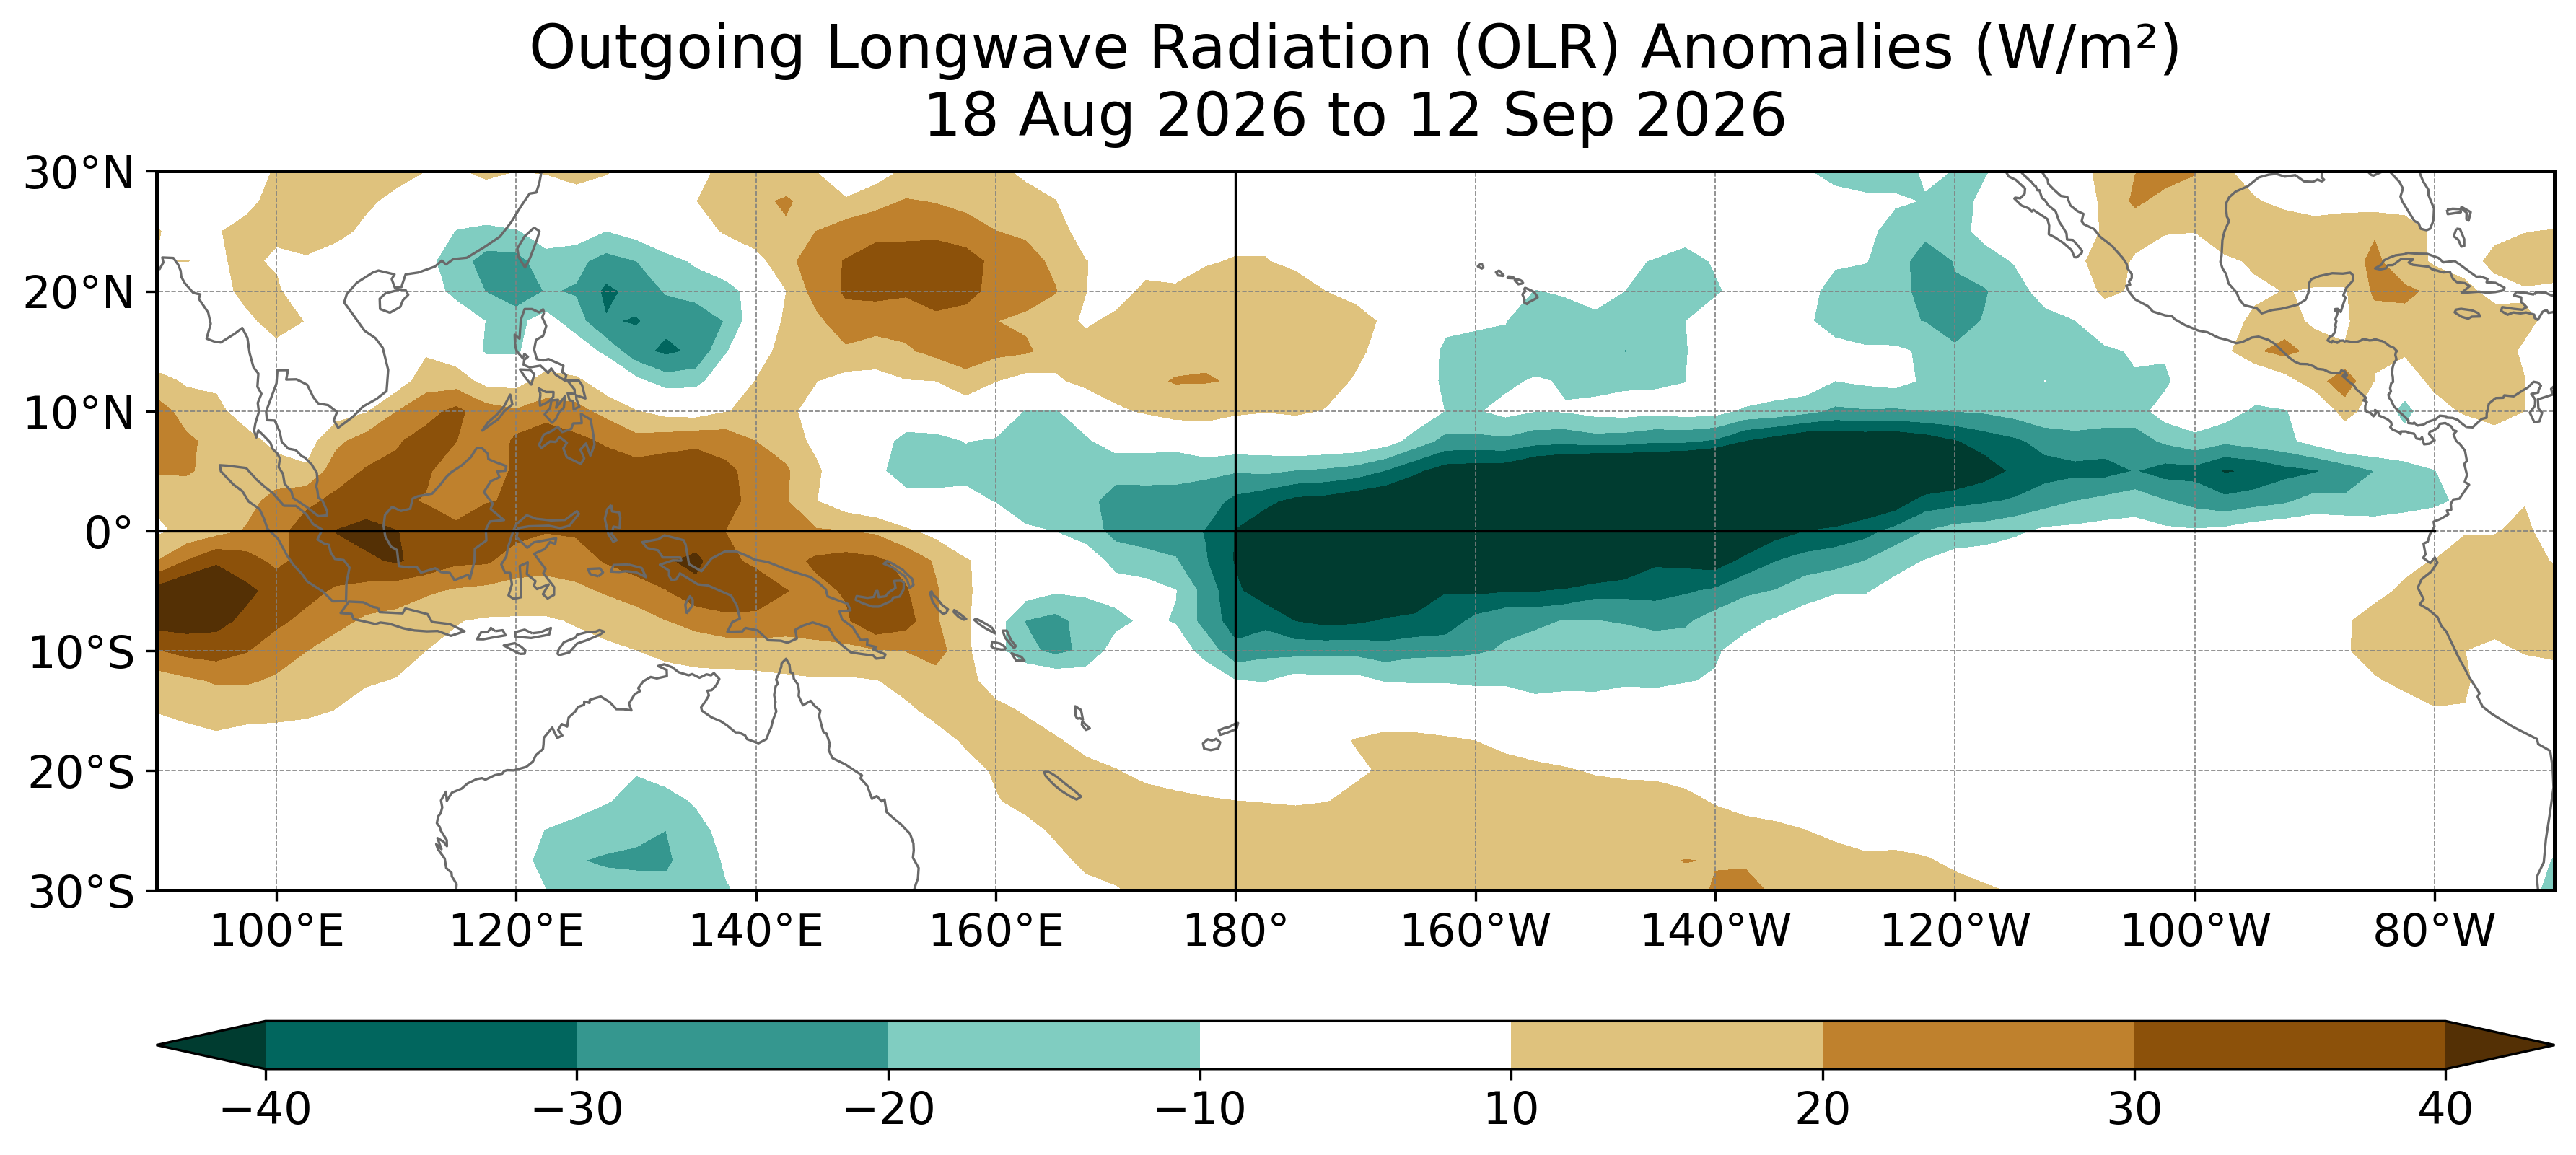
Now, when assessing the atmosphere, my latest SOI index came in today at -37.25, which is Exceptionally Negative; the rolling 30-day average was at -19.66, Moderately Negative & the rolling 90-day average came in at -21.31, which is Strongly Negative. Now the Relative SOI index (RSOI) came in at -22.76 (Strongly Negative. Now, looking over the OLR anomalies, there is record-breaking enhanced thunderstorm & shower activity in the central Pacific, with it strongly suppressed over Indonesia, indicating that the atmospheric response is very El Niño-like, with the latest MEI value at 2.5, averaged between July & August.
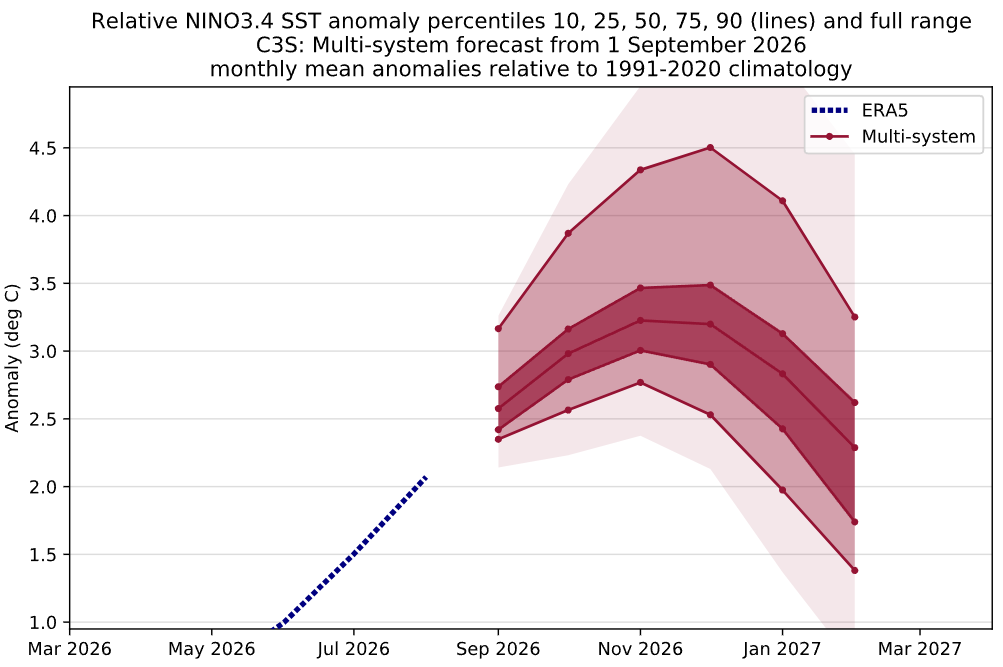
Now, looking ahead at how strong El Niño will get this winter, the Super Ensemble Blend forecasts this El Niño to peak around December with a mean peak of 3.3C, with a range between 3.0-3.5C. Now, the high-end scenario peaks at 4.0-4.5 by December, whitch there is a 2-10 chance of it occuring. Once again, this is an unusslly high confidence forecast that this occurs.
But what does this mean for the winter?
Right now, a stronger El Niño DOES NOT guarantee enhanced impacts across the U.S but only increases the risk chance. So don’t expect record rainfall in the south or west, or record dryness in the north or northwest. Other teleconnections play a role, like the EPO, WPO, PNA, AO, NAO, QBO, and TNH.
Now of course I’ll keep you all posted here in my Blog section if anything changes.
Forecaster………David Schlotthauer.